Tableau Basics: A Comprehensive Guide for Beginners
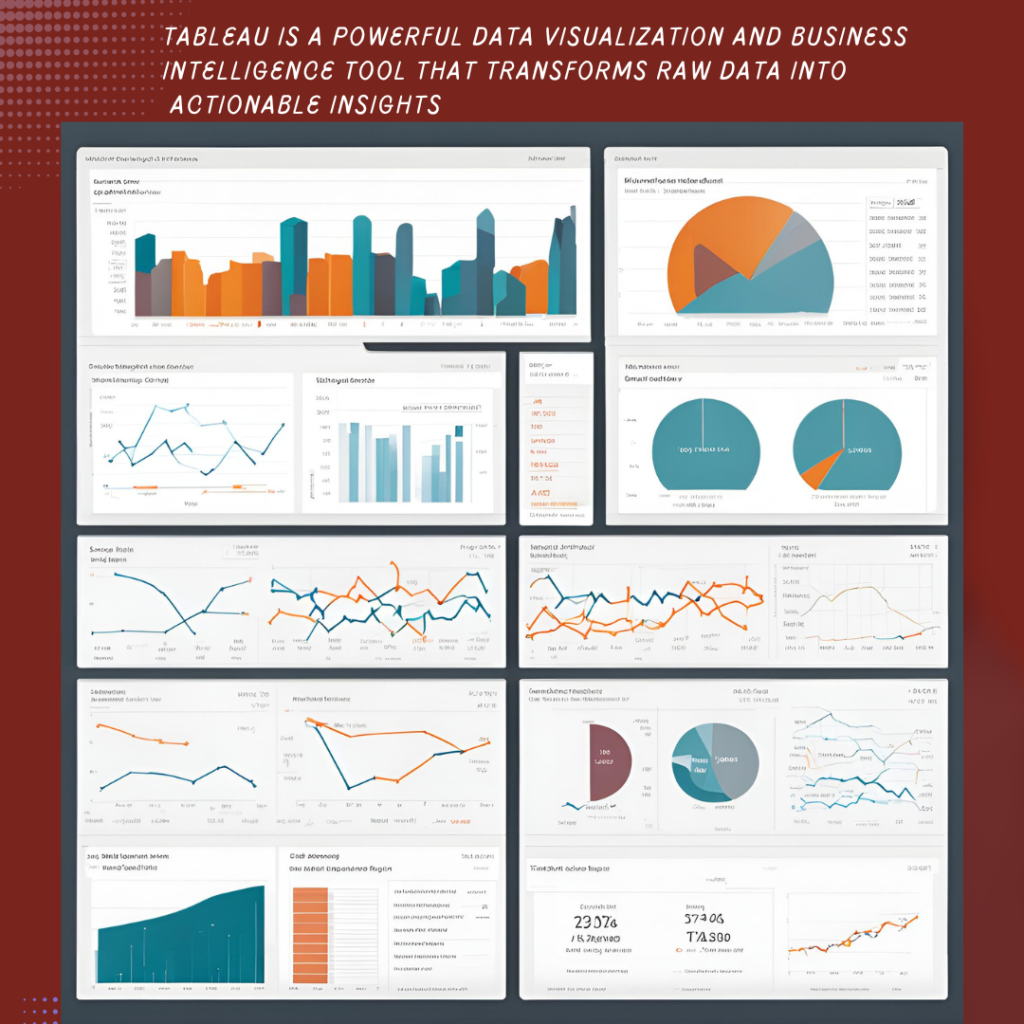
Tableau, a powerful data visualization and business intelligence tool, has revolutionized the way we interact with data. Whether you’re a data enthusiast, a business analyst, or simply someone looking to make sense of complex information, Tableau offers a user-friendly platform to transform data into actionable insights.

Tableau: Your Data, Your Story, Your Success
In an era dominated by data, the ability to transform raw information into actionable insights is paramount. Tableau is more than just a data visualization tool; it’s a powerful platform that empowers individuals and organizations to unlock the hidden potential within their data.
Imagine a world where complex datasets are effortlessly transformed into captivating visual stories. Tableau brings this vision to life. With its intuitive interface and robust features, it democratizes data analysis, making it accessible to everyone from seasoned analysts to business leaders.
By harnessing the power of Tableau, you can:
- Uncover hidden patterns and trends: Identify opportunities and risks that might otherwise go unnoticed.
- Make data-driven decisions: Use insights to guide strategic planning and execution.
- Communicate complex ideas effectively: Create compelling visualizations that resonate with your audience.
- Collaborate seamlessly: Share interactive dashboards and foster data-driven cultures.
Whether you’re exploring market trends, analyzing financial performance, or optimizing operational efficiency, Tableau is your trusted companion on the journey to data-driven success.
Understanding Tableau’s Interface
Tableau’s intuitive interface is designed to make data exploration accessible to users of all skill levels. The core components include:
- Data Pane: Connect to your data sources and manage data fields.
- Worksheet: Build visualizations and explore data interactively.
- Dashboard: Create comprehensive views of your data.
- Story: Narrate your data story through a series of visualizations.
Connecting to Your Data
Tableau supports a wide range of data sources, including Excel, CSV, databases (SQL Server, Oracle, MySQL), and cloud-based platforms. Once connected, you can seamlessly blend data from multiple sources to gain a holistic view.
Building Your First Visualization
Tableau empowers you to create a variety of visualizations, from simple charts to complex interactive dashboards.
- Basic Charts: Explore bar charts, line charts, and pie charts to visualize data patterns.
- Advanced Charts: Utilize scatter plots, bubble charts, and heatmaps for in-depth analysis.
- Geographic Visualizations: Create maps to visualize location-based data.
Mastering Tableau’s Features
Filters and Parameters: Refine your data and create interactive dashboards.
Calculations: Perform calculations and create calculated fields to derive insights.
Data Blending: Combine data from different sources for comprehensive analysis.
Formatting and Styling: Enhance the visual appeal of your visualizations.
Best Practices for Effective Data Visualization
- Choose the right chart type: Match the visualization to your data and story.
- Prioritize clarity and simplicity: Avoid cluttering your charts with unnecessary elements.
- Leverage color effectively: Use color to highlight trends and patterns.
- Tell a story with your data: Create narratives that resonate with your audience.
Tableau is a versatile tool that can be used across various industries and roles. By mastering its fundamentals, you can unlock the power of your data and make informed decisions.
Summary
Tableau is a powerful data visualization and business intelligence tool that transforms raw data into actionable insights. With its intuitive interface and robust features, Tableau empowers users to explore, analyze, and share data effectively.
From creating interactive dashboards to uncovering hidden patterns, Tableau is the go-to tool for data-driven decision making.
Would you like to know more about Tableau’s features or how it can be applied in different industries?


